This tutorial shows how to make an iPhone application that graphs your data. It also provides the fundamentals for incorporating many 2D and 3D graph types in your iPhone applications.
The result of this tutorial is an iPhone application that looks like the following figure when run in the iPhone Simulator.
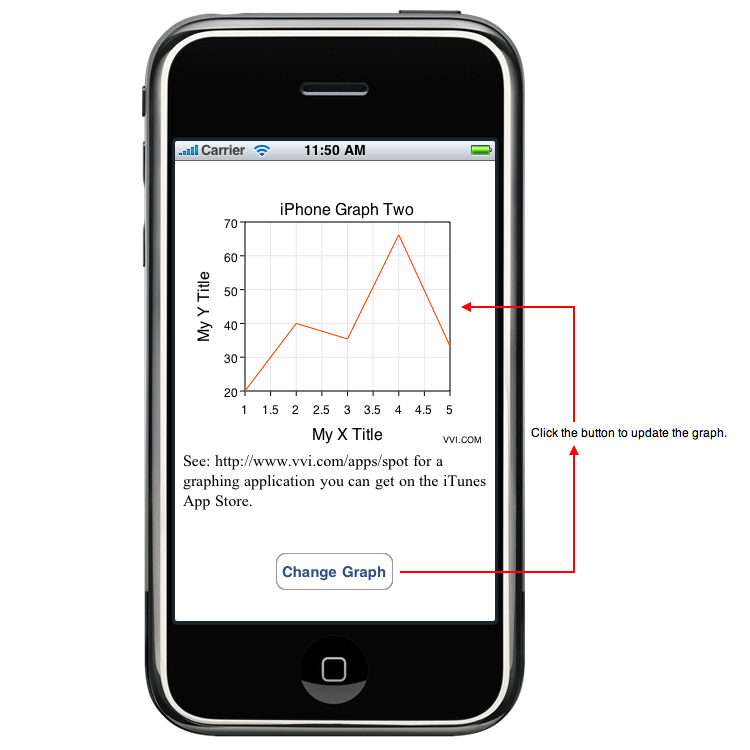
The project described here is closely related to the VVI Spot application which is available on the iTunes App Store. The basic steps for such an application, which are elaborated on in later sections, are as follows:
| Prerequisites: | Download and install Xcode and the iPhone SDK. If you have not done this before then click: http://developer.apple.com/iphone to get started. If you want to graph on your iPhone then you need to provision it, otherwise you can simply use the iPhone Simulator as described in this tutorial. |
| New Project: | Launch Xcode, located on your computer at /Developer/Applications/Xcode, and make a new iPhone OS Application project. |
| Source Code: | Add the source code as described below. |
| Interface: | An iPhone application’s interface is constructed using the GUI tool called Interface Builder. Use that, as described below, to construct a user interface and make connections to the source code. |
| Testing: | Click the Build And Run button within Xcode to test the application. |
| Refining: | Once your iPhone project is graphing while running its target (application) then you can modify the source code to acquire and present your actual data using the graph types, data values and format you choose. Reference are provided at the end of this tutorial for that purpose. |
The following describes the steps above in greater detail. The full project is available at a link given below. You can download that project and build and run using Xcode without reading this tutorial or you can read the following sections to understand how the project was made and then download it.
Make A New Project
Launch Xcode and in its main menu click File > New Project …. and then from the New Project panel select the iPhone OS Application > View-based Application template as shown below.
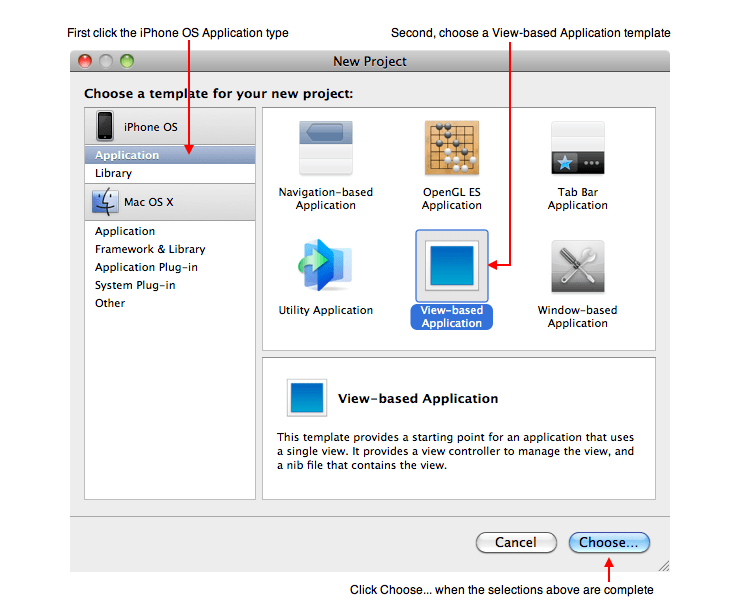
Then click the Choose … button and give the project a name, such as “VVI Graph” and then click Save. The result will be an Xcode project document much like the figures below. The next sections deal with the files VVI_GraphViewController.h which is a source code definition file, VVI_GraphViewController.m which is the file that implements the computer code specific to your needs, and VVI_GraphViewController.xib which is a user interface template document that will be altered using the application Interface Builder for specific features of the application at hand. Remember that VVI_GraphViewController.xib defines the geometry and graphical effects of the interface while VVI_GraphViewController.m implements the functions that are executed by the iPhone application.
Source Code
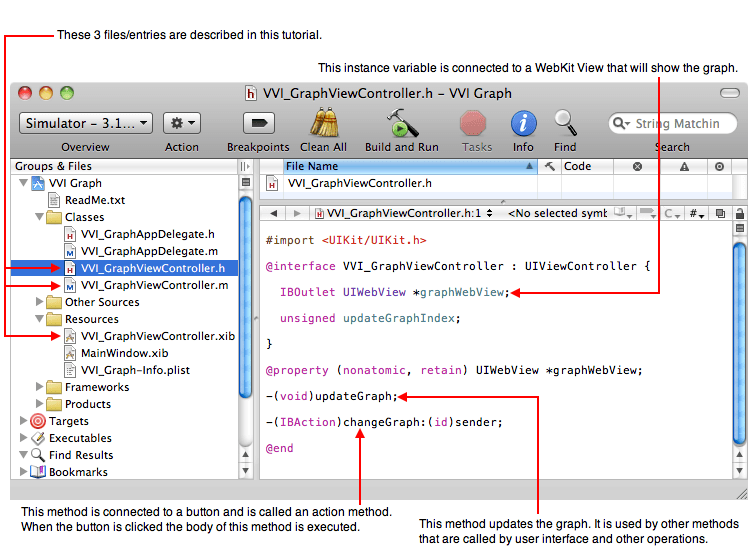
The header file, VVI_GraphViewController.h, defines the interface of the source code but does not implement any function. Click the VVI_GraphViewController.h entry within the Xcode document to the left of the project window as shown below and then enter the information as shown on the right portion of the figure below. The critical part is the instance variable named graphWebView which will be assigned a value within Interface Builder. The code associated with the updateGraph method will perform the actual graph generation routine and the changeGraph: method, known as an action method, will be used to associate an action with a button.
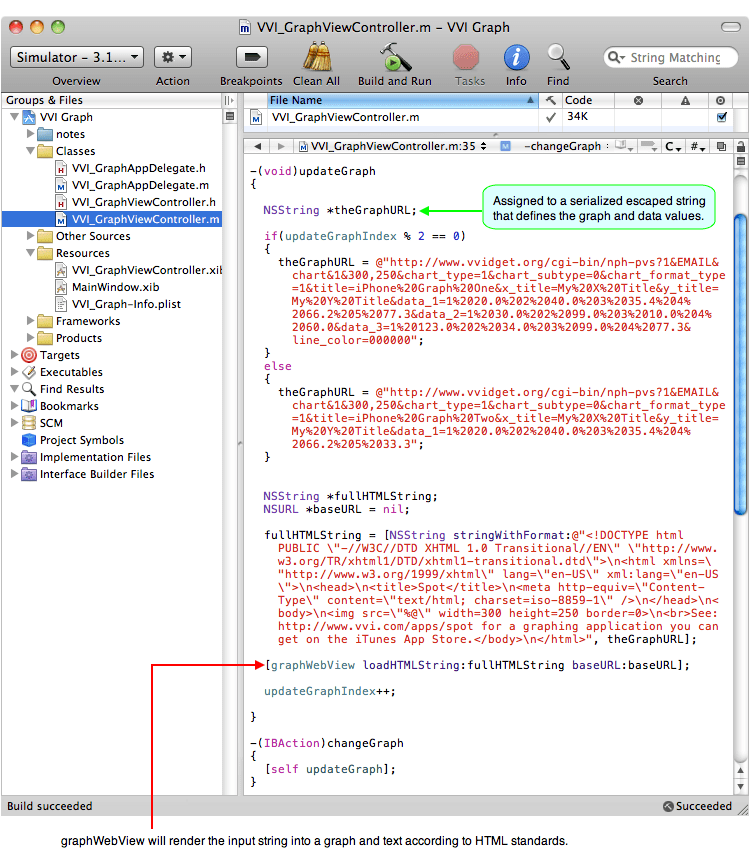
Next, click the VVI_GraphViewController.m entry and then enter the implementation information as shown in the figure below. It is pretty obvious what the code is going to do. It will form a HTML document and enter that into the graphWebView which is a WebKit View that can render HTML code. The relevant part is the theGraphURL string which describes the graph and the data. When you modify the project for your own needs you should serialize your data into the theGraphURL string for display, further reference for that is provided below. As you can see, the iPhone application will query the web service at www.vvidget.org to render the graph onto your iPhone. Before getting into references for those details lets complete the app and get it running.
Interface
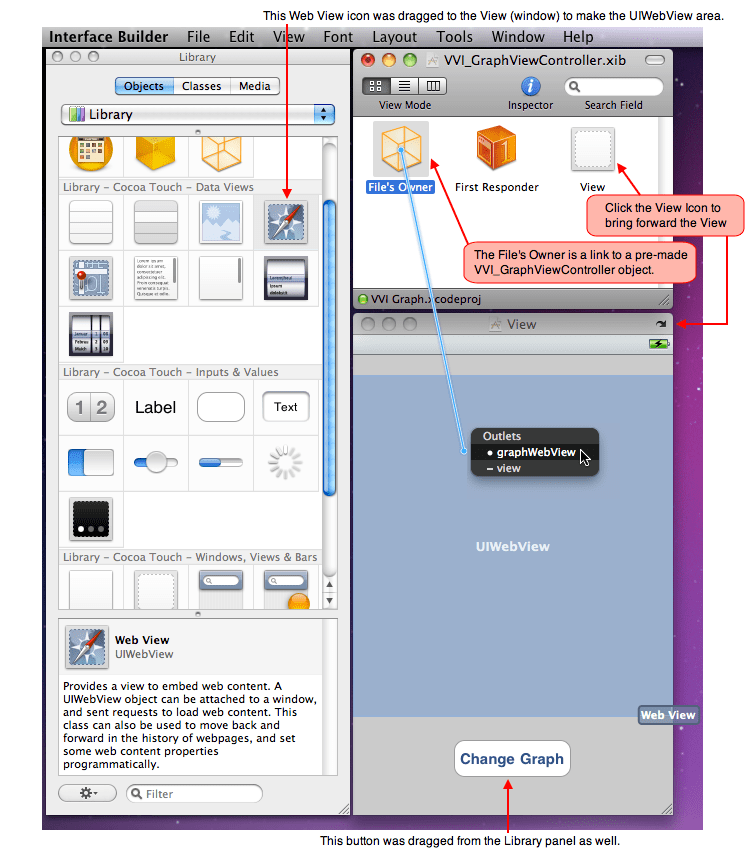
Double click the VVI_GraphViewController.xib file entry in the Xcode project document. That launches Interface Builder with a template of the interface for your application. Double click the View icon, as shown below, to bring up the empty view area. Then drag the Web View Icon from the Library window to the View window. That instantiates (makes) an actual Web View and places it into your iPhone user interface (view hierarchy). That Web View instance needs to be assigned (connected) to the graphWebView instance variable referenced above. Once assigned, the application is functional and a graph will be made. To make that assignment (called a connection) control-drag the cursor from the File’s Owner icon to the Web View frame as shown in the figure below and then click the graphWebView entry in the resulting panel. Then save the document by clicking command-s.
Testing
Click the Xcode project window and then click the Build and Run button. You should now have a graphing iPhone application that runs within the iPhone Simulator.
You can quickly extend the application by dragging a button from the Interface Builder Library onto your interface (as shown in the figure above) and control-drag from that button to the File’s Owner (reverse drag of what you previously did) to connect the button to the changeGraph: action method. Now if you build and run the project then clicking the button will alternate the graph and its data according to the source code shown above.
If you add your provisioning profile to the Xcode project and set the project to build for an iPhone then when you click Build and Run the application will run on your iPhone. Once you do that then you are ready to refine and extend your application.
Refining
Without installing any other packages onto your iPhone or fussing with code you are able to make a line graph. Of course there are still many unanswered questions, lots of detail and a plethora of options. Instead of describing those in detail let me just make reference to those issues with links for further investigation.
| • | You can download the project described above by clicking this link: . |
| • | The project described above is closely related to the VVI Spot application which is available on the iTunes App Store. |
| • | You can read more about the Vvidget graph service at the URL: http://www.vvidget.org/service. The graph service can be setup on your own servers for your iPhone and web applications and is free for educational use. For additional information contact. |
| • | This tutorial uses a client-server system to perform its function. The basic server feature can be extended by integrating typical web app services and database servers for state information and persistent stores. Complex web services use technology like java servlets and database backends but you can also easily use simple scripting systems such as perl, PHP, RoR and flat files to accomplish much the same features of a more elaborate system. |
Conclusion
By following the few steps above even a beginner can make a basic graphing application for the iPhone. With a bit of other knowledge and effort that application can evolve into a robust mobile data entry and display application. The VVI Spot application, available on the iTunes App Store, is just one small example.
Stay connected