Vibration is a true vibration spectrum analyzer using the built in accelerometers inside the iPod Touch and iPhone. It acquires and displays time series data, optionally removes DC bias, applies a Hamming window and performs an FFT on each channel to produce frequency spectra. The accelerometer has a sensitivity of approximately 0.02g and a range of ±2g making the iPhone and iPod touch sensitive enough to analyze the vibration of most moving machinery.
The software is very flexible and easy to use. It was written to simulate the familiar oscilloscope based spectrum analyzer. Sample rate and sample delay are easily adjustable using sliders and the user can select the length of the data acquisition and the vertical scale used for the display. Once the settings are configured to your preference, press the sample button and the data is acquired.
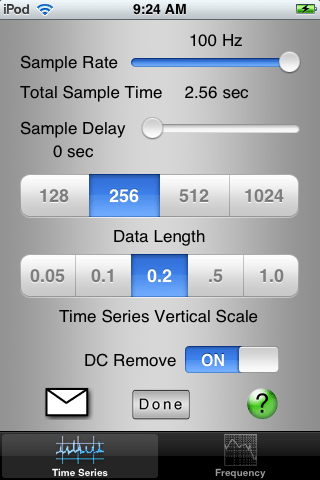
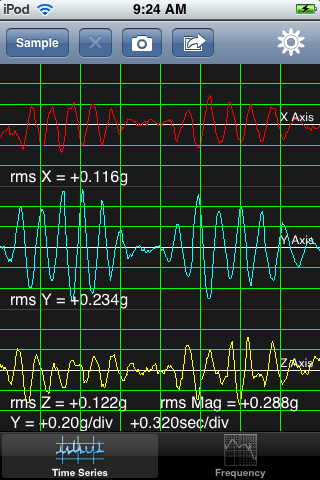
The time series display also reports the rms amplitude of each of the individual traces as well as the rms magnitude of all three axes combined.
To see the frequency data simply touch the frequency tab at the bottom of the screen.
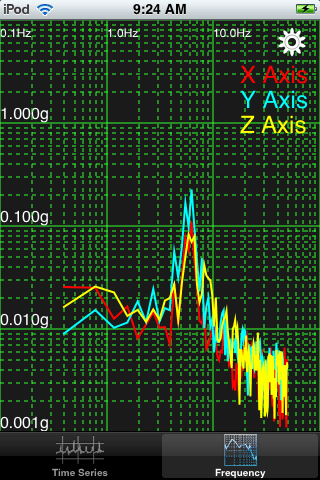
The frequency data can be viewed in linear-linear, log-linear, linear-log and log-log format. You can turn and off the display of each axis individually. You also have the option of applying a Hamming window. All of these options can be modified after data acquisition making it simple to view the data in a variety of different ways.
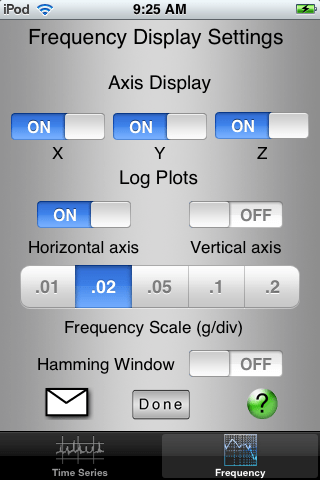
Frequency Display Settings
All of the settings are persistent so the configuration remains consistent between runs and when you quit and restart the program.
There are two options for documentation. If a screen capture of the amplitude and frequency screens is sufficient just press the camera icon and both images are saved to the iPhoto library and will be sync’d with your computer the next time you connect. For access to the actual time and frequency data, press the send button and Vibration will create an email with the amplitude and frequency data embedded in the body of the email in CSV format.
Table of Contents
Features
- Adjustable sample rate from 10Hz to 100Hz
- Selectable data length from 128 to 1024 samples
- Variable start delay from 0 to 20 seconds
- Adjustable vertical scale for both time series and frequency data
- DC Remove option to get rid of that annoying gravity vector
- Switchable Hamming window for frequency analysis
- Frequency data plotted as Linear-Linear, Log-Log, Log-Linear and Linear-Log
- Computes rms vibration for each channel and for all three channels combined
- Document your results by taking screen snapshots and syncing them to your computer or by sending an email of CSV formatted amplitude and frequency data.
Limitations of the iPhone and iPod Touch
Of course the iPhone and iPod were not designed as spectrum analyzers and there are limitations in the hardware which affect the performance.According to the documentation, the maximum sample rate for the accelerometer is 100Hz, limiting the maximum frequency to 50 Hz.The sensitivity of the individual channels appears to be about 0.01g rms. This tool is not sensitive enough for measurement of disturbances on a vibration isolation table but it is sensitive enough to measure most moving machinery.There is a limited amount of RAM in the devices and I found that for data series longer than 1024 points the acquisition slowed down because of memory management issues. If there is a need for longer data series I may be able to improve the efficiency of memory usage.Amplitude data acquired in 128 point and 256 point modes is displayed live as it is acquired. For the 512 point and 1024 point modes only a progress bar is displayed. Because of the way the plotting routines update the screen the redraw time was taking too long on the large data sets.
Feature Requests
I am very amenable to requests for additional features. The iPhone SDK is quite powerful and it is relatively easy to add new features. If you have suggestions for improvements to Vibration send me an email at btruax (at) dld-llc.com. Also, beta testers are welcome.
Stay connected